Postman is an exceptionally well-regarded REST API client that developers rely on to construct and evaluate their APIs. It started with a Chrome extension which later got deprecated, so they moved into the desktop app. However, after the success of the HoppScotch Open Source Web-based Rest API client, Postman also launched their web-based API client.
But have you ever contemplated how Postman operates behind the scenes? Fortunately, debugging web applications today is a breeze, as the comprehensive Chrome DevTools enable you to deconstruct any application on the web. In this article, we will learn how Postman Web works and HoppScotch indeed works very similarly.
We will delve into the inner workings of Postman's web application and explore what transpires when you use it to test your HTTP requests. To do this, we'll use Requestly Mock Server to create a couple of dummy API endpoints. We'll then analyze the behaviour of Postman using the network tab of our browser's DevTools, allowing us to deconstruct the application's operations.
Setting up an API Server (Mock Server)
If you’ve ever used Postman before, this should appear familiar. We’ll work with two simple requests today - a GET request and a POST request. We’ll then inspect the network tab in the chrome dev tools to figure out how Postman communicates with the actual API endpoint that we test.
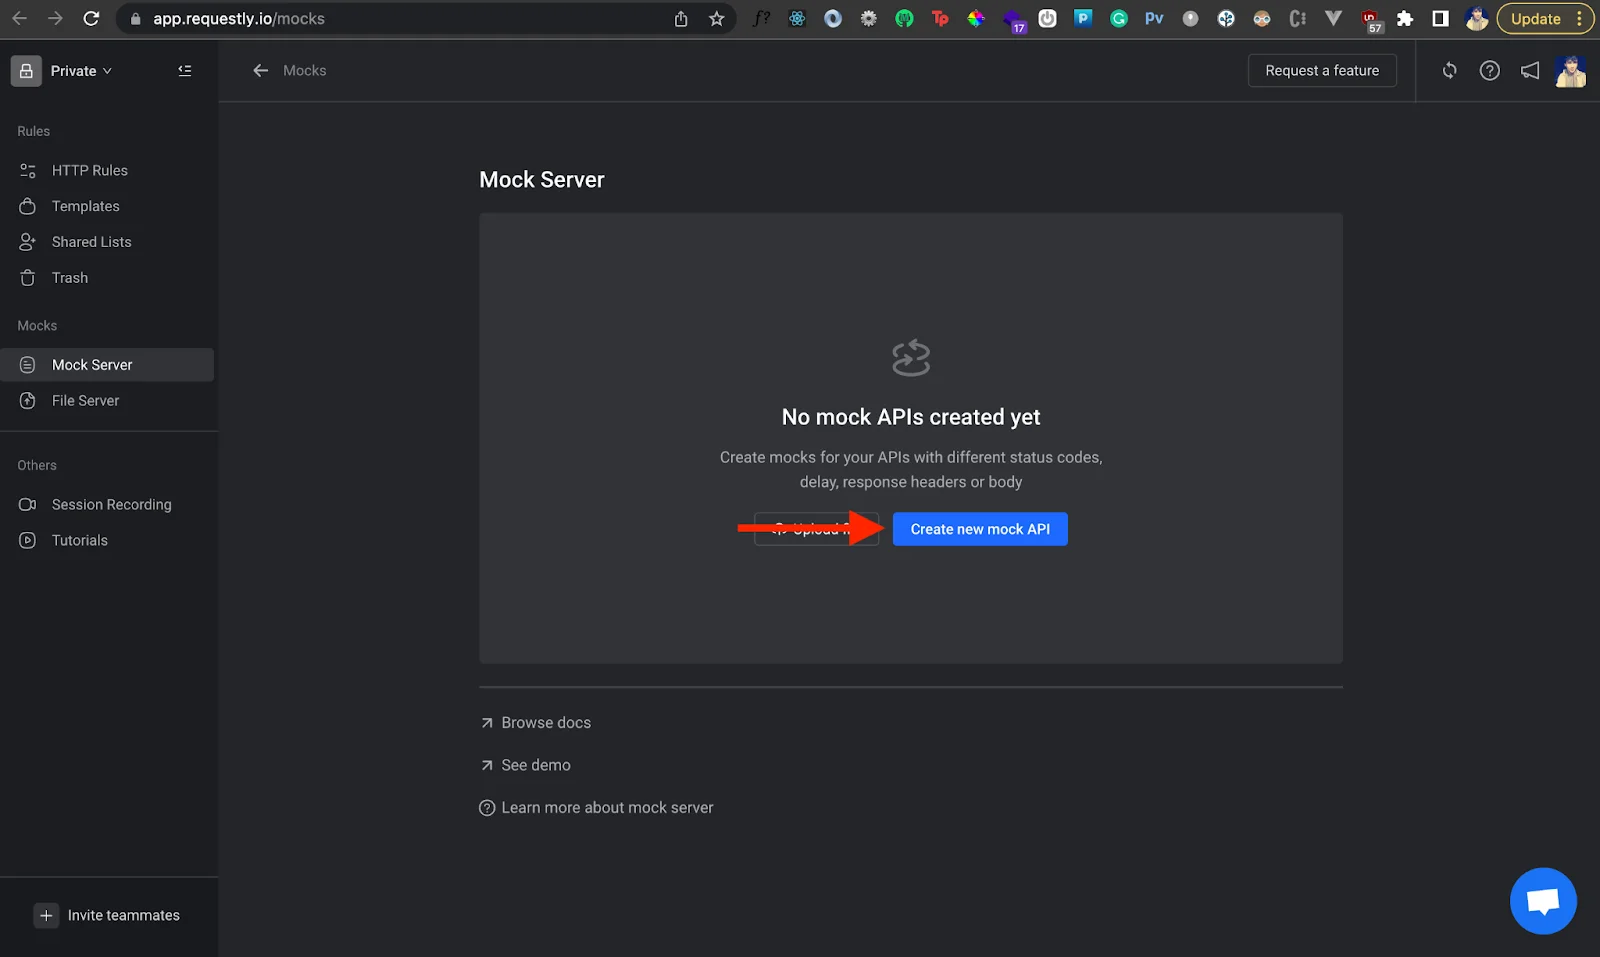
First, let’s quickly set up a mock server with Requestly - an open source browser extension that fast tracks your web debugging process. We can it use to simulate our test APIs. Once installed, head over to Requestly's Mock Server and click on Create new mock API.
That should open a simple form where you can specify details of the API and the mock server. Let’s choose the Method GET, Endpoint as Postman_GET (you can put this literally whatever you want) and have a simple sample response in the body. After that, click on the “Create” button at the top right corner. Then, Requestly should generate a mock API endpoint for you under the URL section that you can now use with Postman:
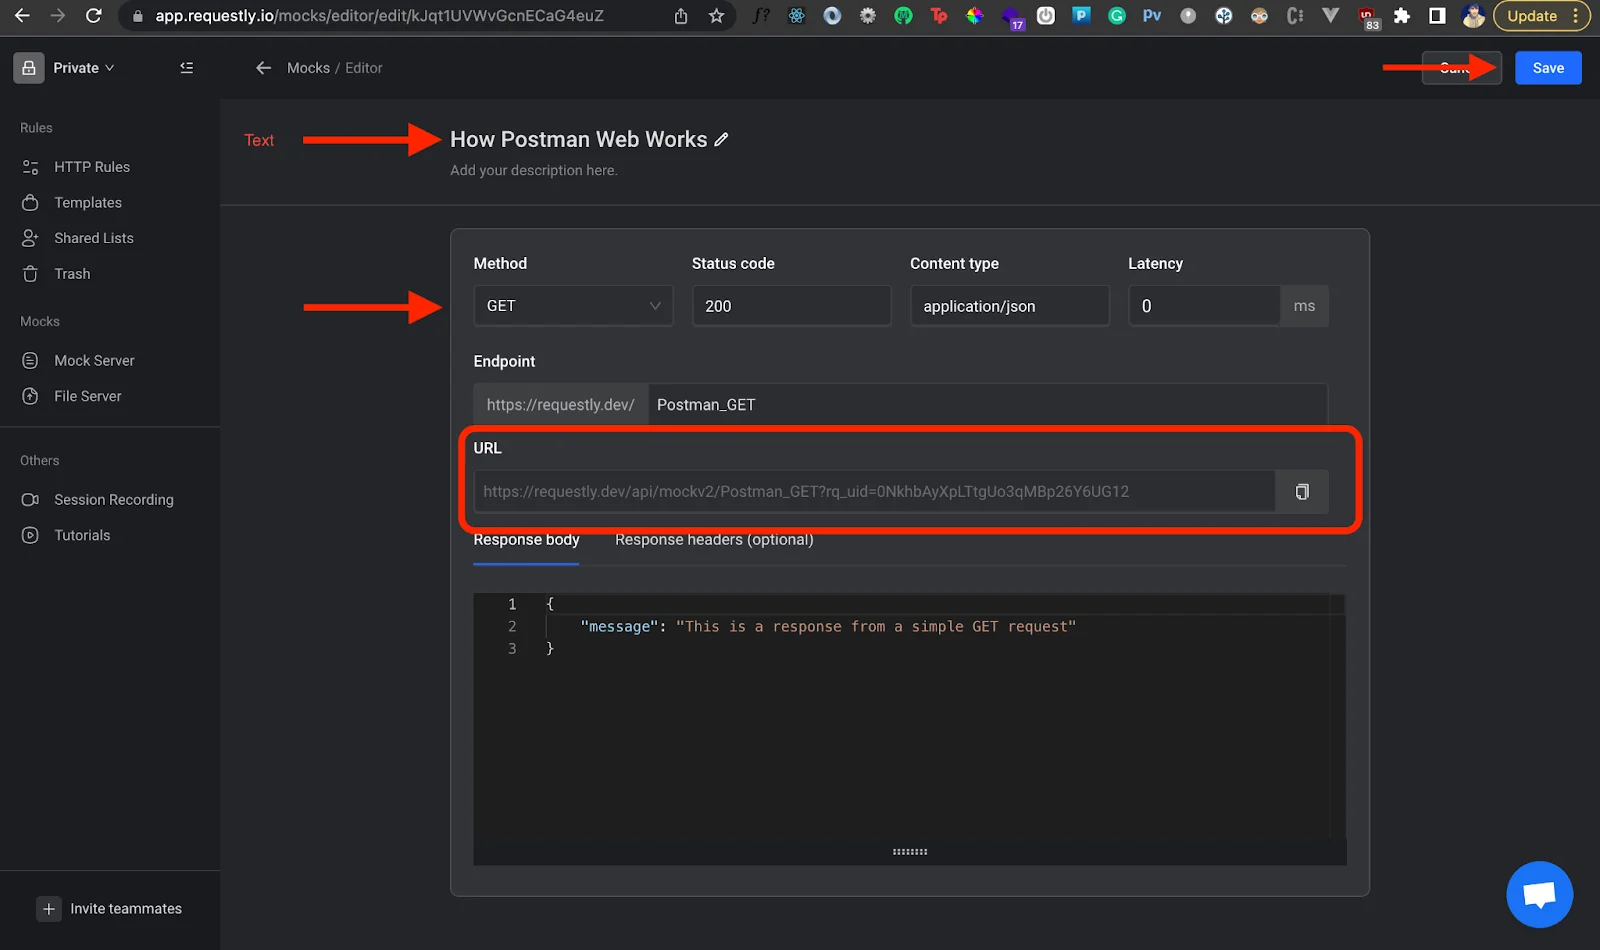
Great! We managed to spin up a mock API server with Requestly in minutes. But that’s not all you can do with Requestly. Interestingly, you can also inspect network traffic with Requestly to analyse HTTP requests.
Inspecting Network Traffic
Requestly Desktop App offers Inspecting & Modifying network traffic from browsers, mobile apps, desktop apps, Node server & Terminal. In order to inspect traffic from Postman desktop app, we can use System-wide proxy option available in Connected source.
However, to inspect traffic from Postman web, we can launch a new Chrome instance and get all the traffic. Here’s how you can launch a new Chrome instance from Requestly Desktop app:
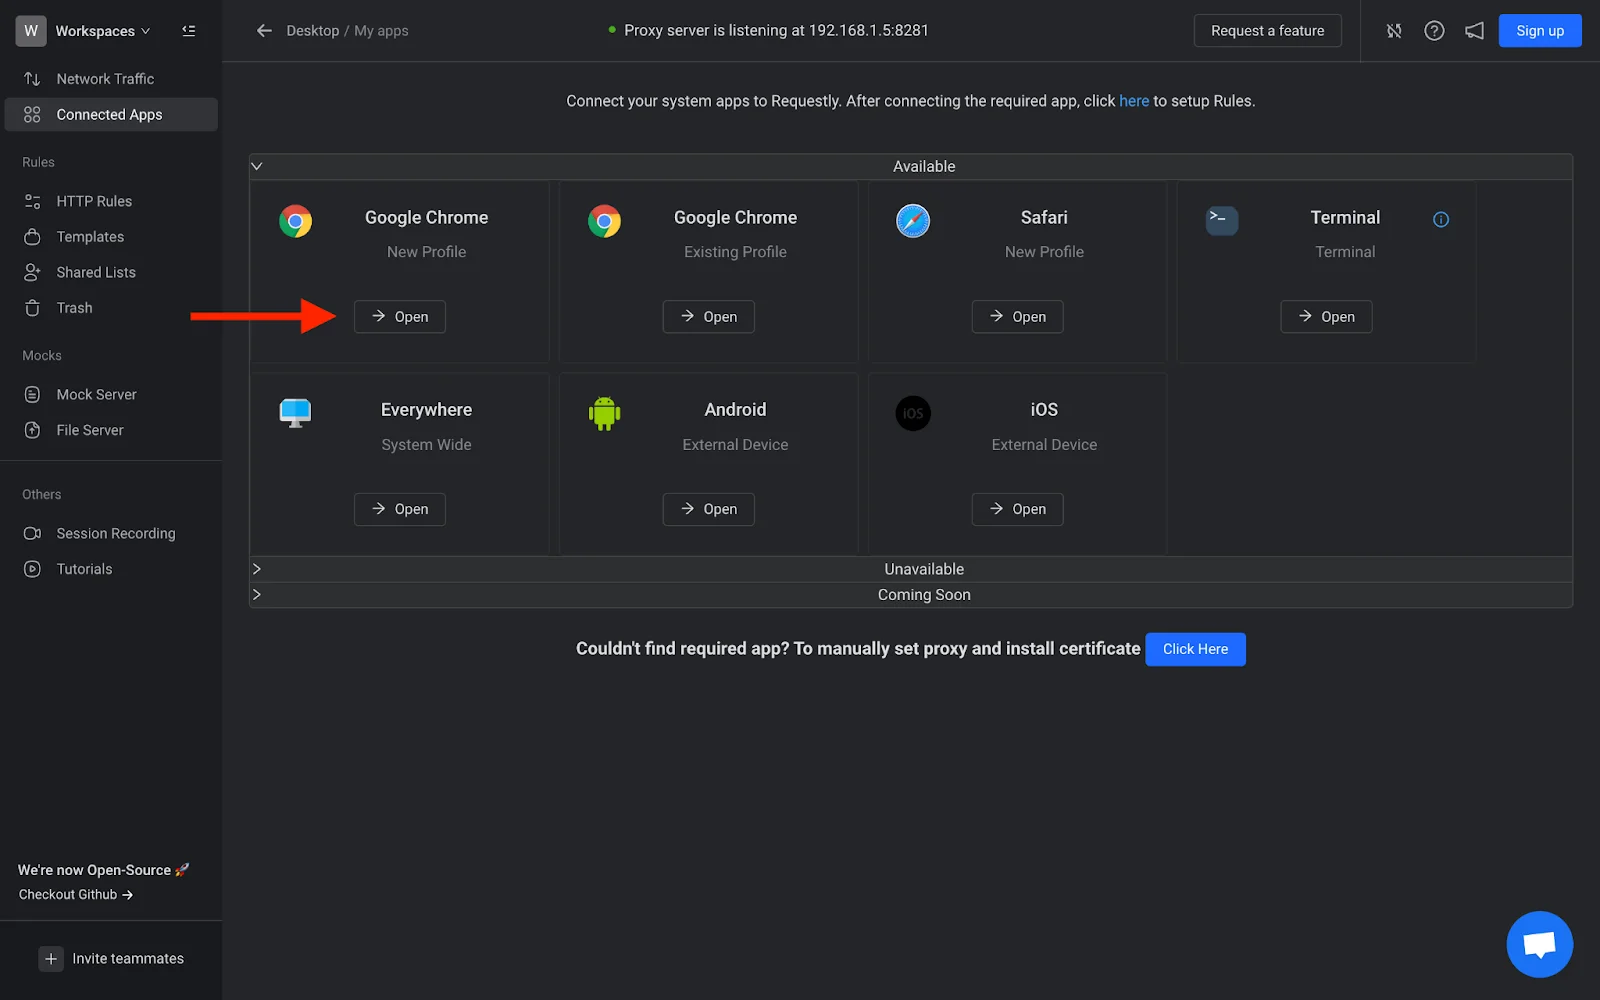
And then you can actually inspect all the network traffic on that chrome instance:
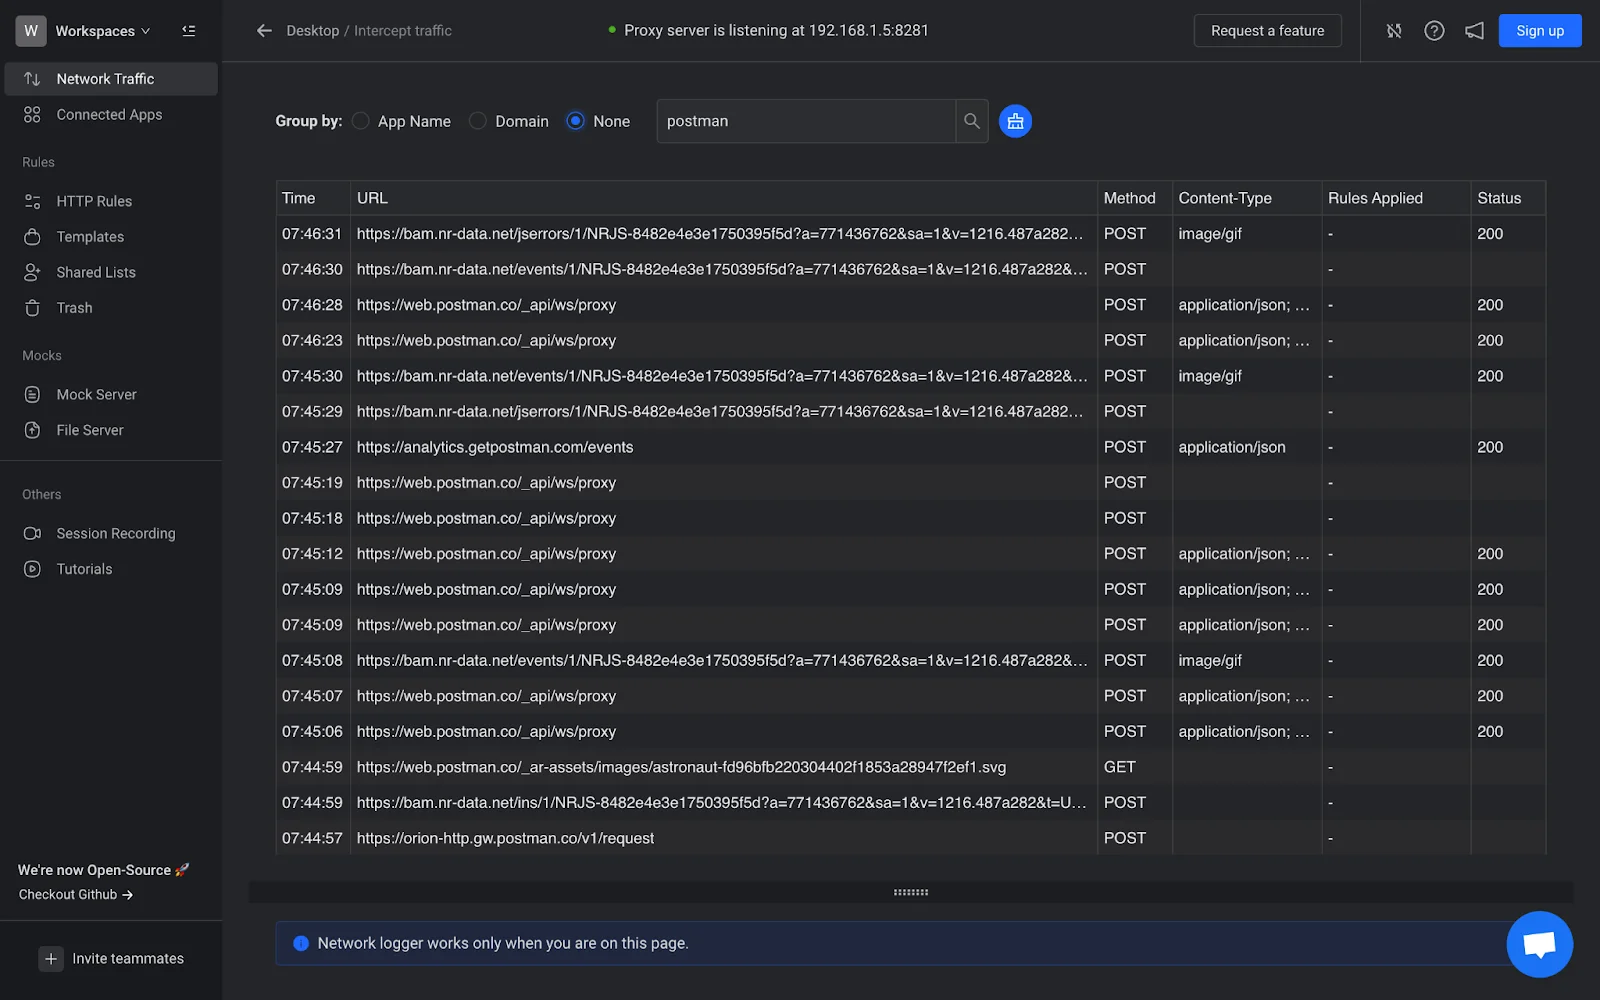
That is pretty cool indeed! You can further filter the traffic based on a specific domain and modify network traffic from Postman web using Requestly. However, since the requirement here is only to inspect network traffic and not modify it, we will use Chrome dev tools so let’s move ahead with that.
Sending a request with Postman Web
Let’s use the Mock API endpoint we just created in Postman Web and hit the “Send” button after setting the request type to “GET”:
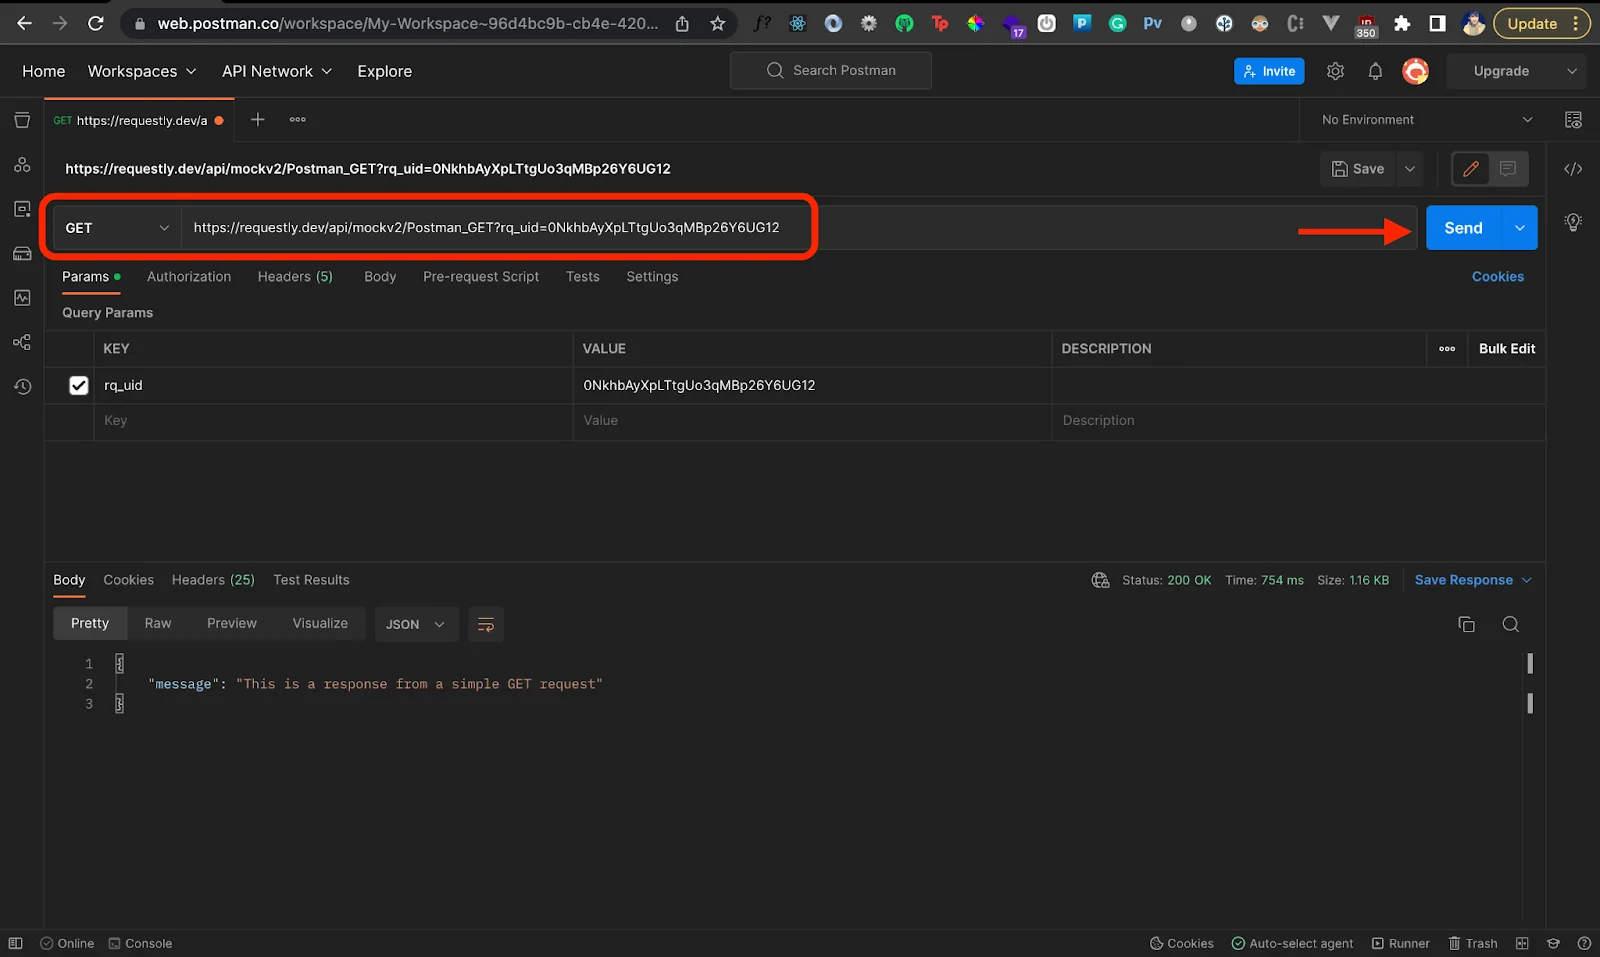
Postman displays the response from the API and it’s the same response that we defined. But how does this happen? What does Postman do behind the scenes?
Decoding the GET Request sent with Postman Web
In order to decode this GET request, open chrome dev tools and go to the network tab:

Notice that there are two requests being sent by Postman. The second request with the name “request” is what we’re actually interested in. Let’s click on it and inspect that request further:
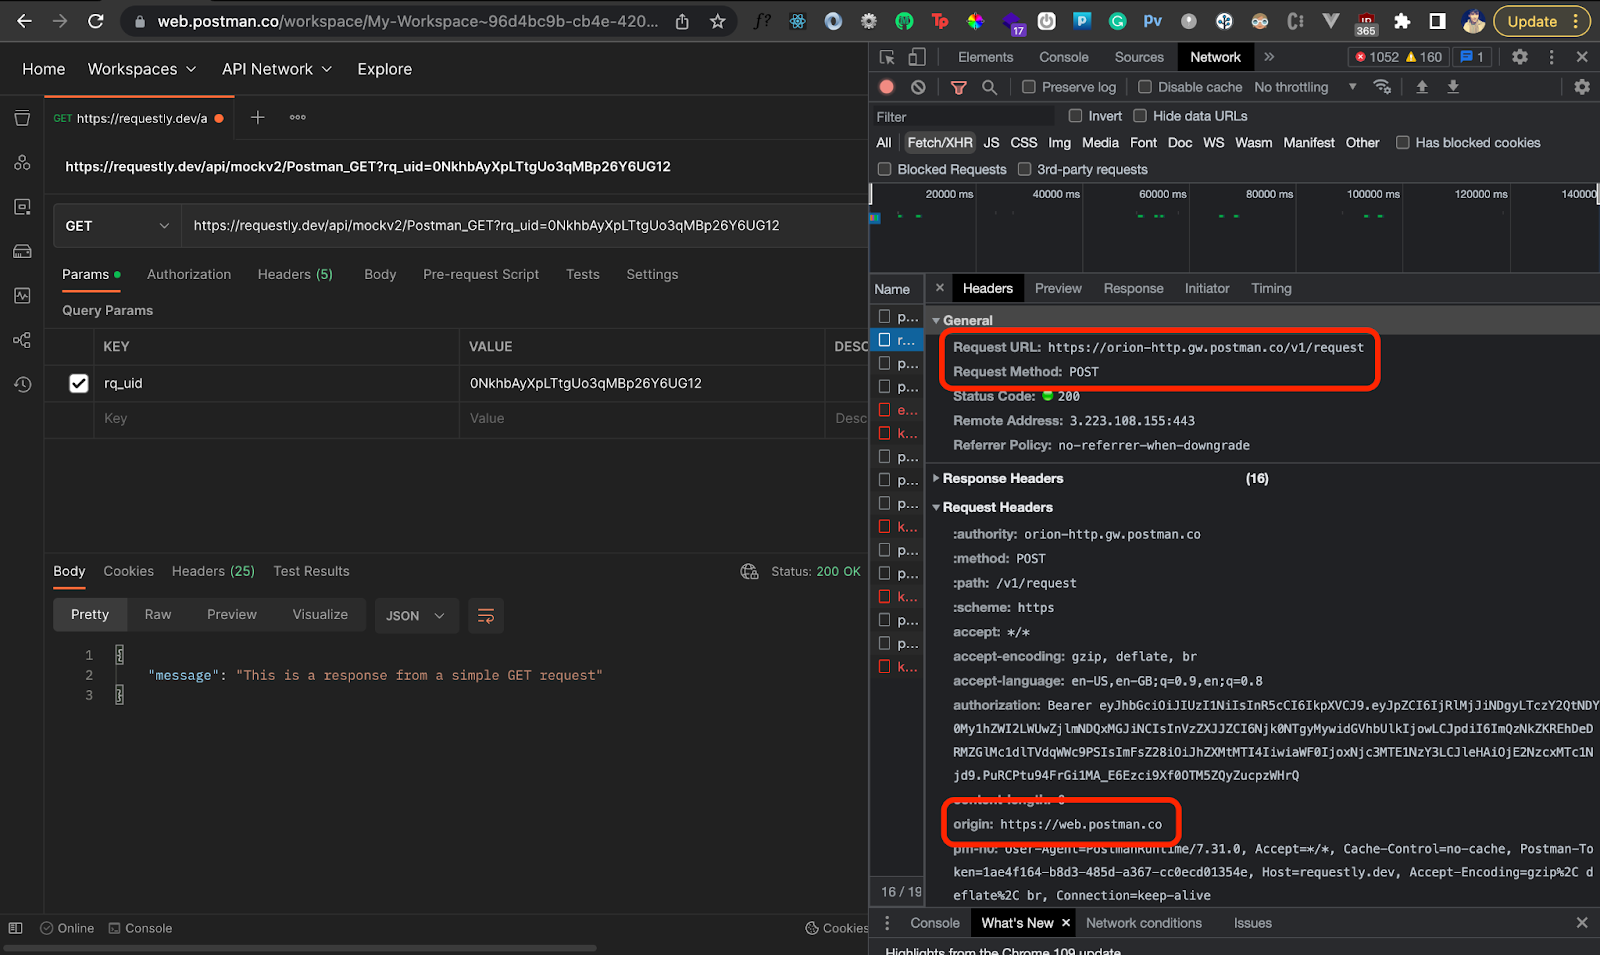
Notice how Postman sends a POST request to the URL https://orion-http.gw.postman.co/v1/request and the origin specified in the request headers is https://web.postman.co. It’s strange that Postman is not directly sending the request to the original caller or the API URL https://requestly.dev/api/mockv2/Postman_GET?rq_uid=0NkhbAyXpLTtgUo3qMBp26Y6UG12. Instead, it’s sending the request somewhere else, a different server hosted on Postman’s sub-domain.
We’ll come back to the answer to the above question in a bit. Let’s preview the response to this request and verify that we’re actually inspecting the correct request!
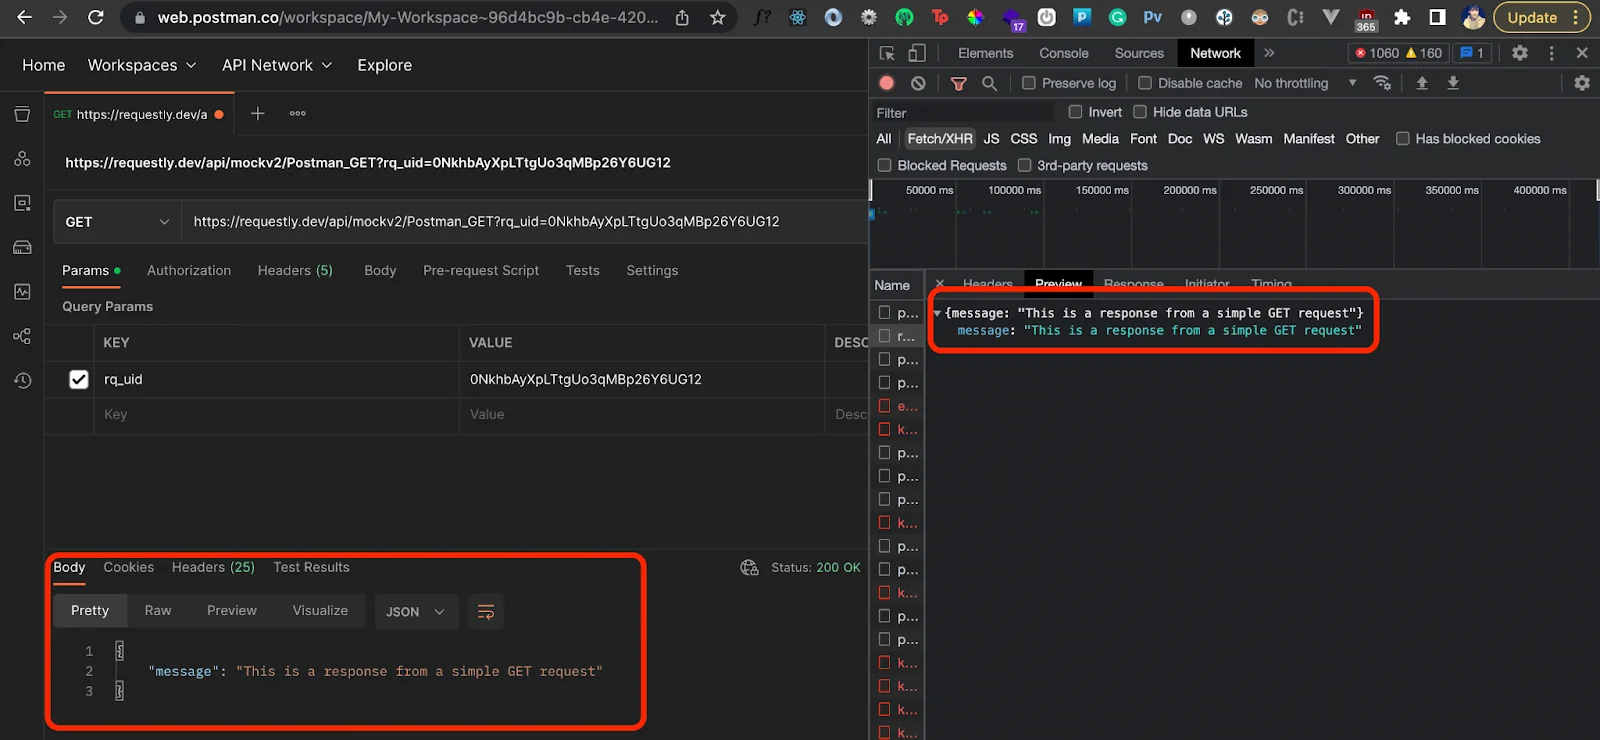
Well, the response to this request is the actual response received from the GET request so it is the correct request that Postman sent to populate the response tab on the Postman web interface. But wait, where did postman specify the URL of the actual HTTP request? Even though this is a POST request, we don’t see any POST parameters in the body of the request.
Let’s scroll down further on the request headers. If you look closely, there are a bunch of options that are prefixed with “pm”:
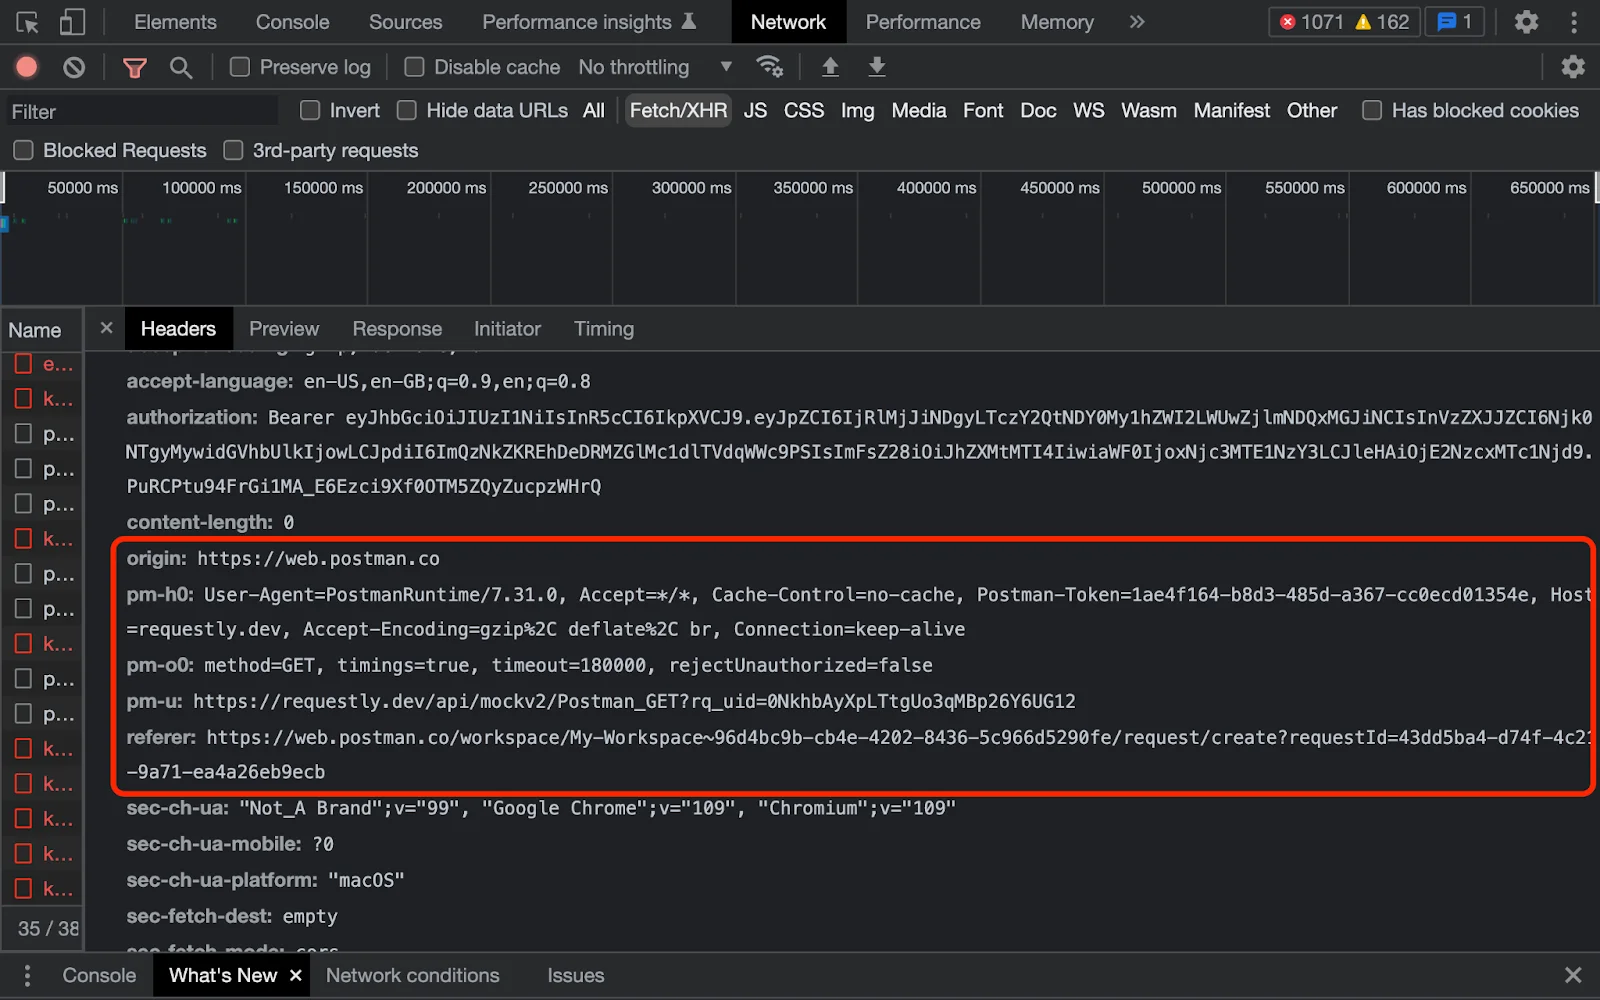
These are the following request headers prefixed with “pm” that Postman sent in the request:
- pm-h0
- pm-o0
- pm-u
The “pm-u” option is actually the part where Postman has specified the API URL to which the actual request is sent. The method or the type of request, which in this case is GET is set in the “pm-o0” option.
It looks like Postman specifies the request metadata it sends via these custom headers prefixed by “pm-”. Interesting!
Decoding a POST Request sent with Postman Web
We’ve seen how a GET request works with Postman, let’s also see how a POST request works. Let’s now use the Requestly Mock Server to generate a POST endpoint now:
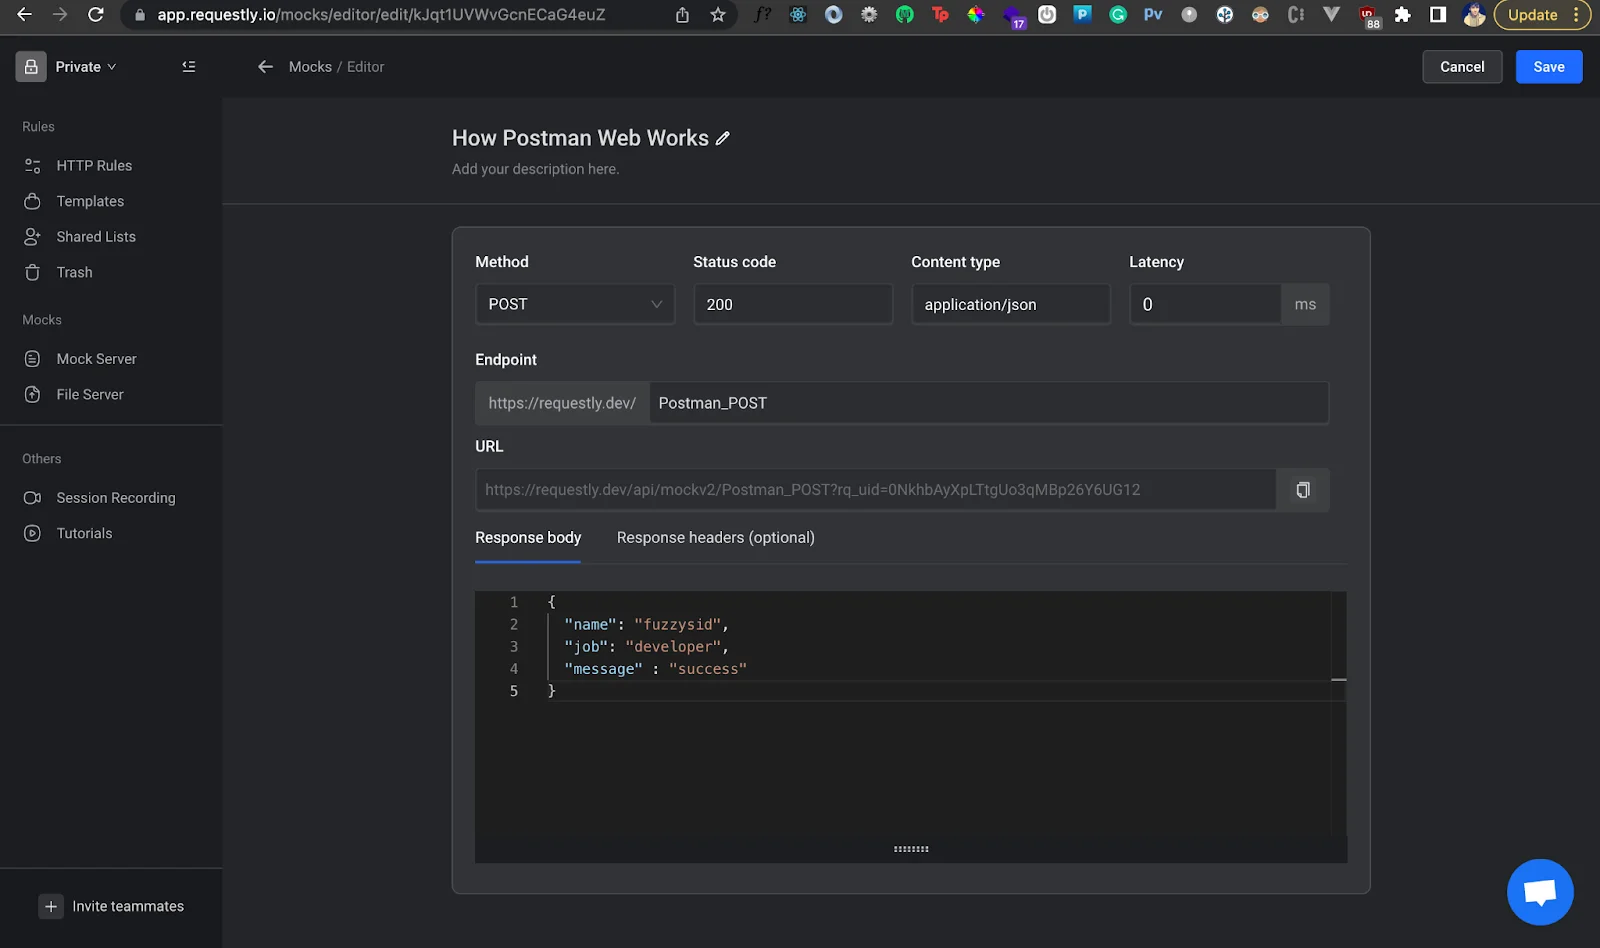
This is a similar way to how we generated the GET endpoint only now the Method field would be POST instead. We’ll send a POST request to the new endpoint with the following JSON:
Let’s send this request, open the network tab and see what the request looks like:
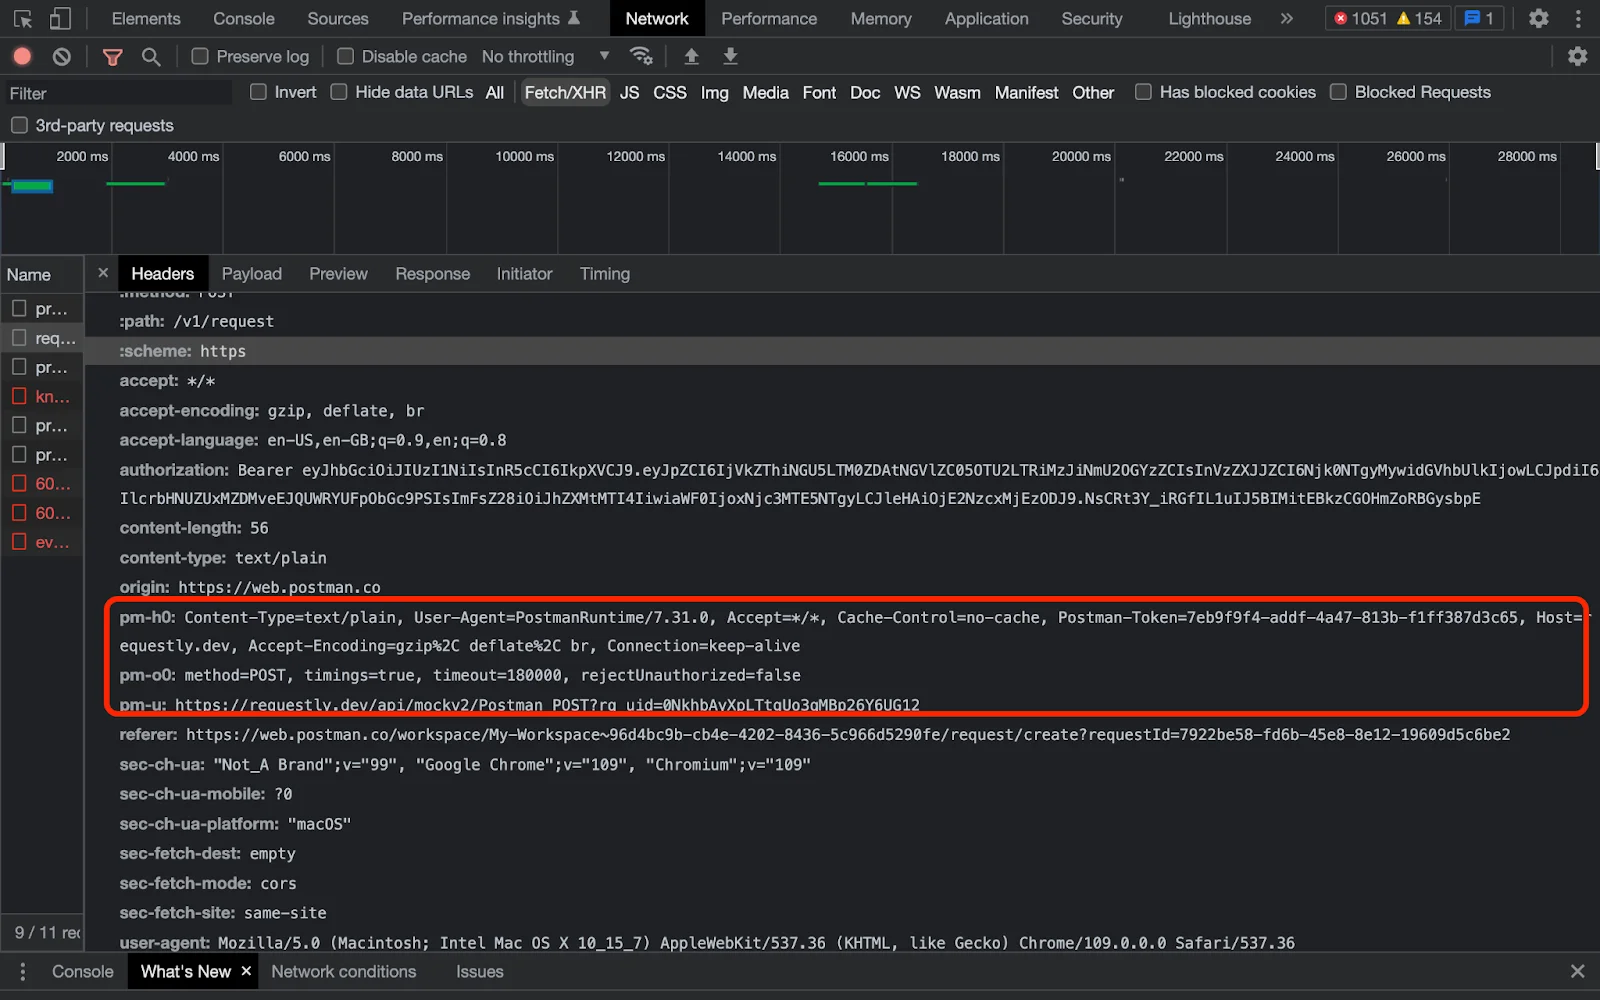
Again, Postman sends a request to its own server and you can now see the same “pm-” prefixed options in the request header specifying the API URL. The “pm-u” in the request header now corresponds to the new endpoint. The “pm-o0” option now specifies the method as POST.
Further, the payload to this request is the actual payload sent to the original request:
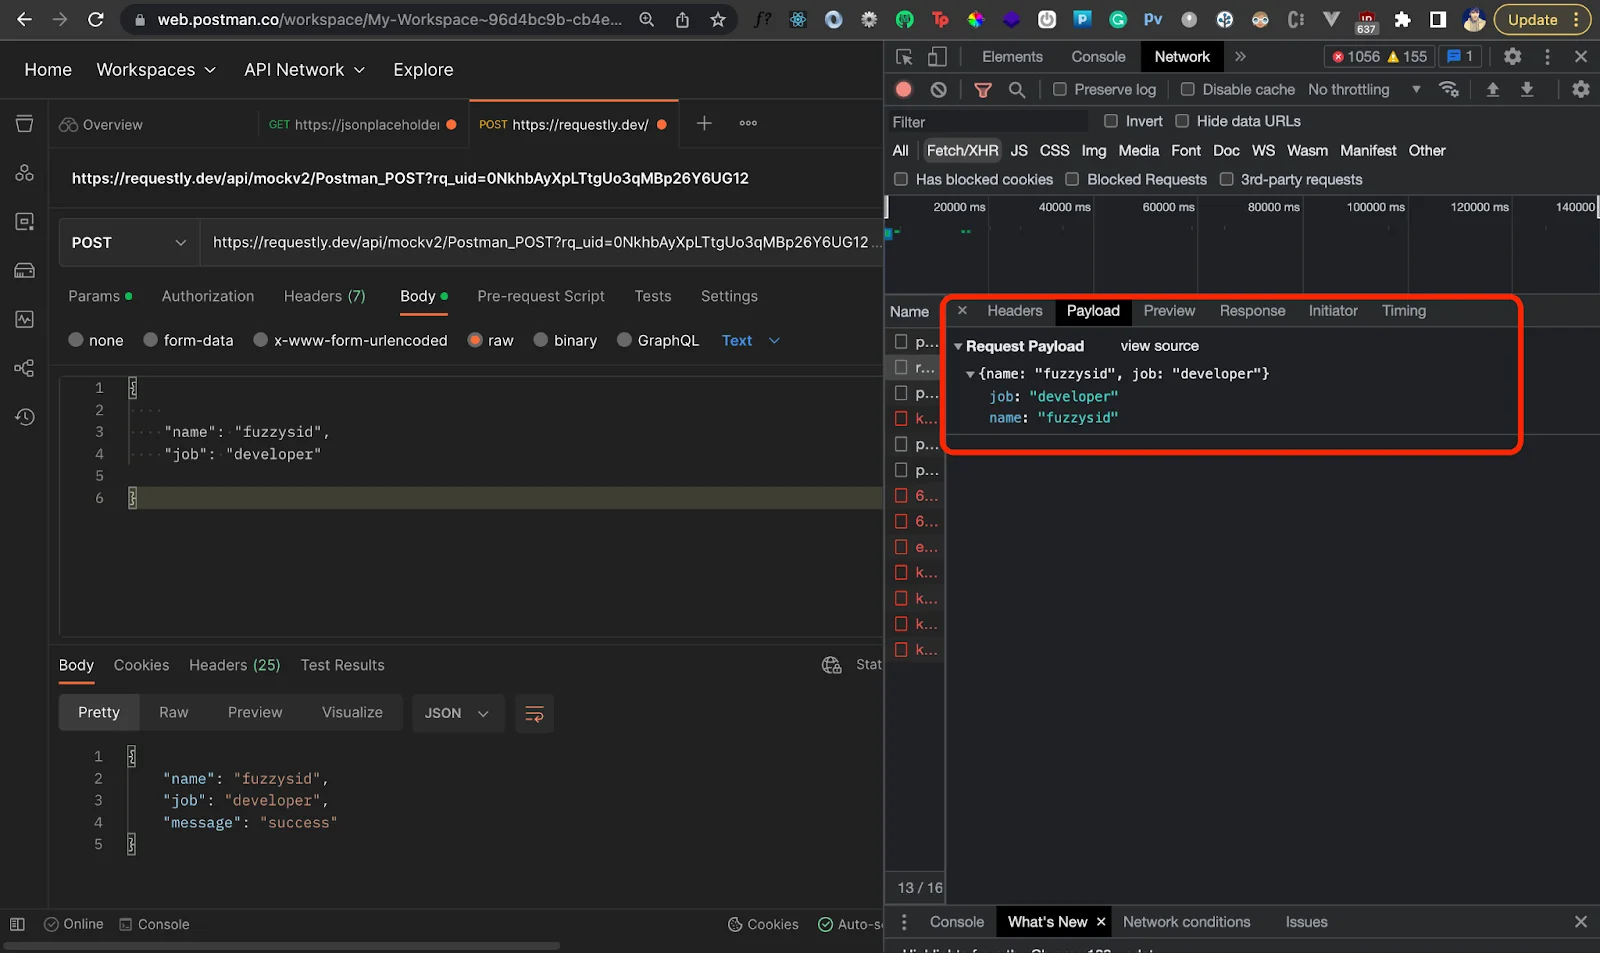
Looks like a POST request is more or less straightforward to understand once you’ve managed to decode a GET request.
Why does Postman send requests to their own Server?
It was fun inspecting the network tab and trying to make sense of what’s happening under the hood when you send a GET and POST request with Postman. But it’s finally time to address the elephant in the room.
Why can’t Postman directly send an HTTP request to the endpoint we want to test directly?
The answer lies in the fact that all requests go through Postman's web application via the browser. Consequently, any request made through Postman web must pass through the browser first.
CORS
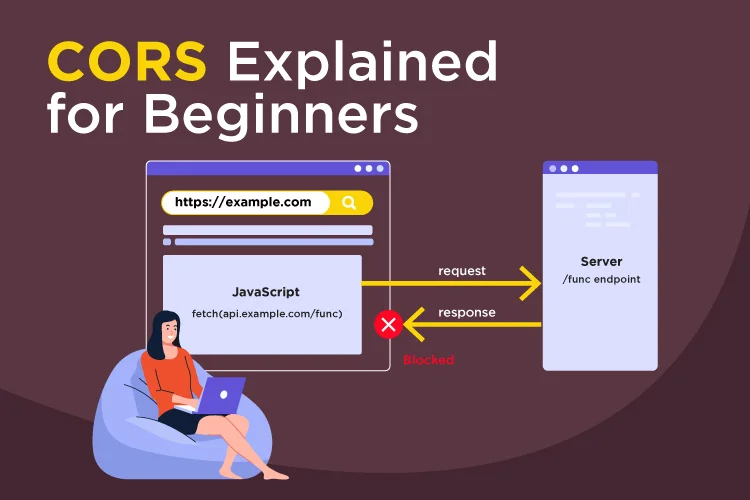
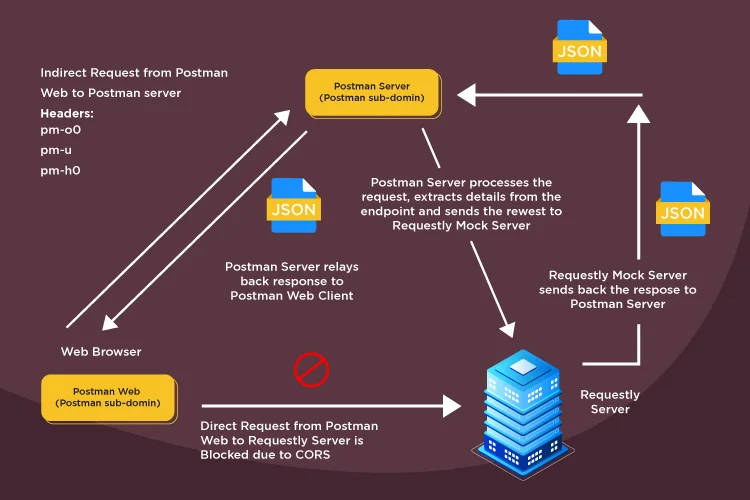
The reason why Postman can't send an HTTP request directly to the endpoint that you want to test is due to the Cross-Origin Resource Sharing (CORS) mechanism implemented by web browsers. CORS is a security feature implemented in web browsers that prevent web pages from making requests to a different domain than the one that the page originated from. This security check is in place to prevent malicious scripts from performing actions on behalf of the user without their knowledge. So when a request is made through Postman, it is intercepted by the browser, which checks whether the domain that the request is being made to is the same as the one from which the request originated. If the domains do not match, the browser blocks the request and throws a CORS error.
Visually here’s what CORS is to help you understand better:
In our case, the referrer in the requests represents the domain from which the request is sent which is of the form "https://web.postman.co/workspace/My-Workspace~96d4bc9b-cb4e-4202-8436-5c966d5290fe/request/create?requestId=7922be58-fd6b-45e8-8e12-19609d5c6be2&ctx=code"
That means requests are sent from the above URL to our Requestly Mock endpoints. The origin or the referrer of the request and the request URL both are on different domains. Therefore the browser will throw a CORS error if Postman tries to directly send this request.
To bypass this restriction, Postman sends this request to its proxy server (https://orion-http.gw.postman.co/v1/request) which then forwards the request to the intended endpoint. This proxy server has the same sub-domain as the origin or referrer in the request Postman sends. On receiving the request from Postman web, the proxy server extracts endpoints, payload etc from the request via the “pm-” options in the request header. The response from the endpoint is then relayed back to the Postman web application which then forwards it to the client's browser. This way, the request appears to come from the same domain, and the CORS security check is satisfied, allowing the request to proceed without any issues. We have explained how postman handles CORS issues in this blog in detail.
Conclusion
Today, we not only gained a comprehensive understanding of how Postman web functions, but also explored the art of reverse engineering a web application with ease. It was an engaging experience delving into the intricacies of Postman web through the DevTools & Requestly Mock Server, and there's still much more to uncover from here. However, there remain a few unanswered questions that may require further exploration.
For example, why does Postman not utilize POST parameters to define the API URL and other metadata when it is already sending the proxy request as a POST request? Additionally, the "pm-" prefix in the custom headers likely stands for "Postman," but the suffixes in the custom header options such as "o0" in "pm-o0" may still be unclear. Is there a particular naming convention that must be followed when defining custom headers in an HTTP request?
As you ponder these questions, be sure to stay tuned for our upcoming guide on something fresh and exciting.
.svg)


.png)
.png)


