.svg)

Introduction
Google Chrome Developer Tools (DevTools) is perhaps one of the most useful tools you’ll come across as a web developer. These tools allow developers to analyze, test, and debug software. In this article, we’ll be mainly focusing on the Network tab in DevTools.
Chrome DevTools is used to check whether the resources and scripts used in the development of the page are being downloaded and uploaded as expected in the Google Chrome browser. Everything, from the page and script load times, status, and even their properties, can be monitored, tested, and managed.
In this walkthrough of Chrome DevTools, we’ll take a look at a simple website to gain an understanding of the tool and get familiar with it. So, in a new window opened side by side, go to https://example.org and open DevTools by pressing control + shift + j (cmd + shift + c in Mac). Alternatively, you can right-click on the page and select Inspect element. Next, navigate to the network tab button and click on it.
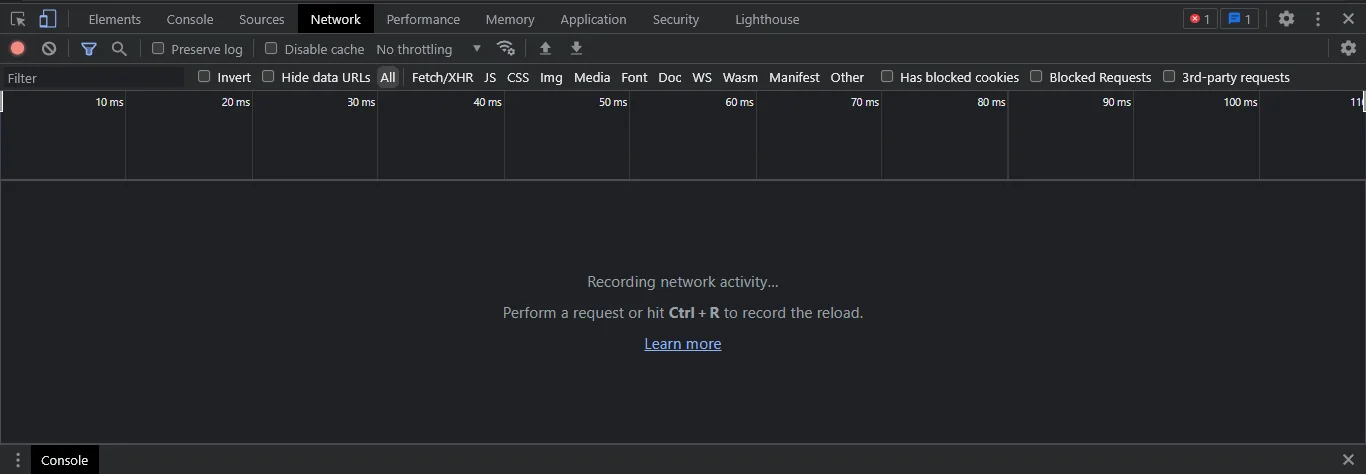
Initially, the log will be empty as it doesn't record any network activity before being opened. Reload the page, and you should see a script called example.org.
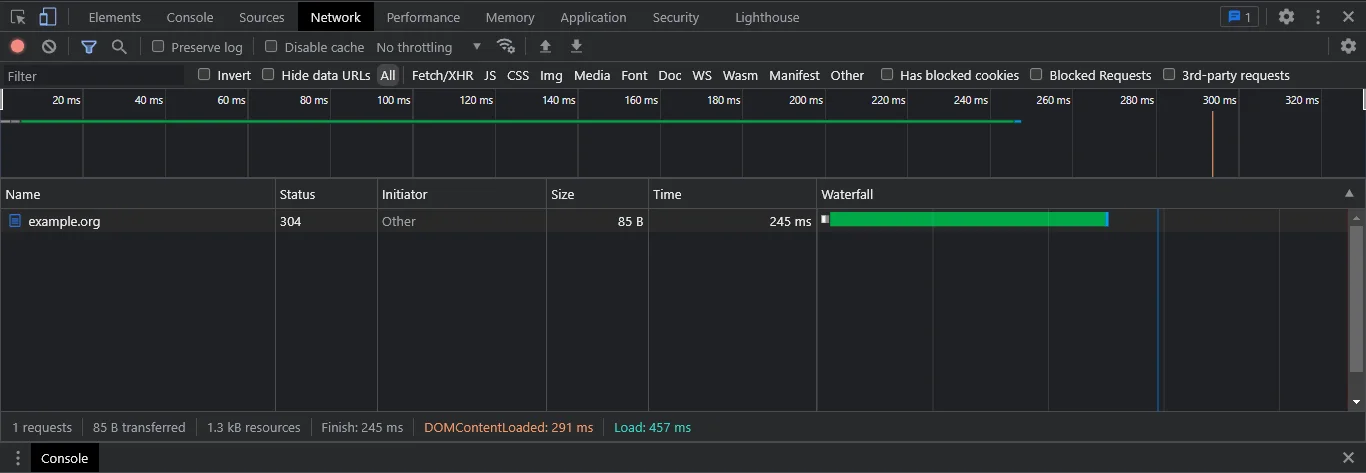
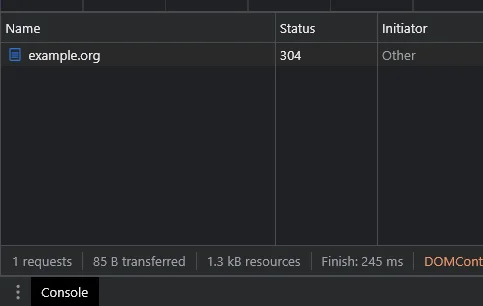
At the bottom of the DevTools Network panel, you'll see the number of requests made by the page (i.e., number of requests to load the scripts, API calls, style sheets, multimedia files, etc.), amount of data transferred over the network for loading the page, size of resources loaded onto the webpage and time taken to load the scripts and page.
When you click on the example.org script, you should see a new panel pop up on the side with several other panels listing the properties associated with the script.
Types of Network Panels
Headers
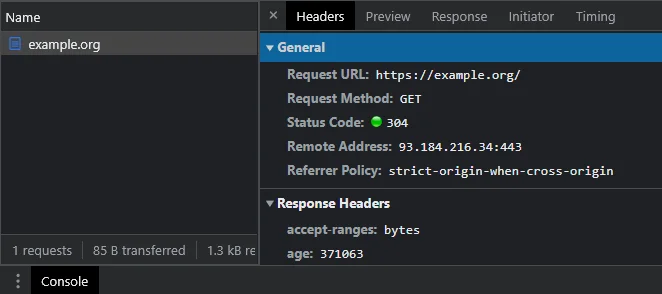
First comes the Headers panel. It shows the headers that the server is requesting to load the webpage. It is used to carry information about the request itself for communication between the client and server. The headers panel primarily contains three sections:
General: In this section, you will find some general information about the HTTP request:
- URL: This displays the URL to which the request is being sent.
- Request Method: This is the HTTP method used for the request, such as GET, POST, DELETE, PUT, etc.
- Status Code: The HTTP response status code indicates whether a specific HTTP request has been successfully completed. Examples include 200 (OK), 404 (Not Found), 500 (Internal Server Error), etc.
Response Headers: These are headers that the server sends back to the client in the HTTP response. They contain useful information about the response and about the server itself. Some common ones include:
- Content-Type: This indicates the media type of the resource being returned by the server, such as application/json, text/html, etc.
- Content-Length: This shows the size of the response data in bytes.
- Set-Cookie: This sends cookies from the server to the client.
- Cache-Control: This field is used to specify directives for caching mechanisms in both requests and responses.
Request Headers: These are headers that the client sends to the server in the HTTP request. They contain information about the request and about the client itself. Some common ones include:
- Accept: This specifies the acceptable media types for the response.
- Origin: This is used in a CORS (Cross-Origin Resource Sharing) scenario to indicate where the request originated.
- User-Agent: This contains a characteristic string that allows the network protocol peers to identify the application type, operating system, software vendor, or software version of the requesting software user agent.
- Content-Length: In a POST or PUT request, this indicates the size of the body data.
Preview
The Preview panel allows you to view and interact with the rendered output of certain file types (like images, fonts, and other media files) that are loaded by a webpage. It provides a visual preview of the selected resource, allowing you to see the file's content without opening it in a separate application or tab.
Response
The Response panel allows you to view the data sent back from the server in response to a request made by your web page. It can include any type of data, such as HTML, CSS, JavaScript, images, and other resources. The Response panel shows the raw data, which can be helpful for debugging issues with the data returned by the server.
Timing
The Timing panel gives a detailed description of the request's arrival and load times. A simplified and illustrative view of the Timing panel is present in the Network log section, which goes by the name of Waterfall. This tool is used to get an overview of the arrival timings of the several requests a webpage makes and to optimize the page accordingly.
Initiator
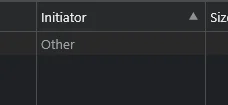
The Initiator panel shows how the script was initiated. There are different initiators possible for a request. Some of the possible values that could be displayed here are:
- Parser: This appears when Chrome's HTML parser initiates the request.
- Redirect: This is displayed when an HTTP redirect initiates the request.
- Script: The script's name is displayed when a script initiates the request.
- Other: This means that the script was initiated by the user navigating to the page or by typing in the URL into the search bar.
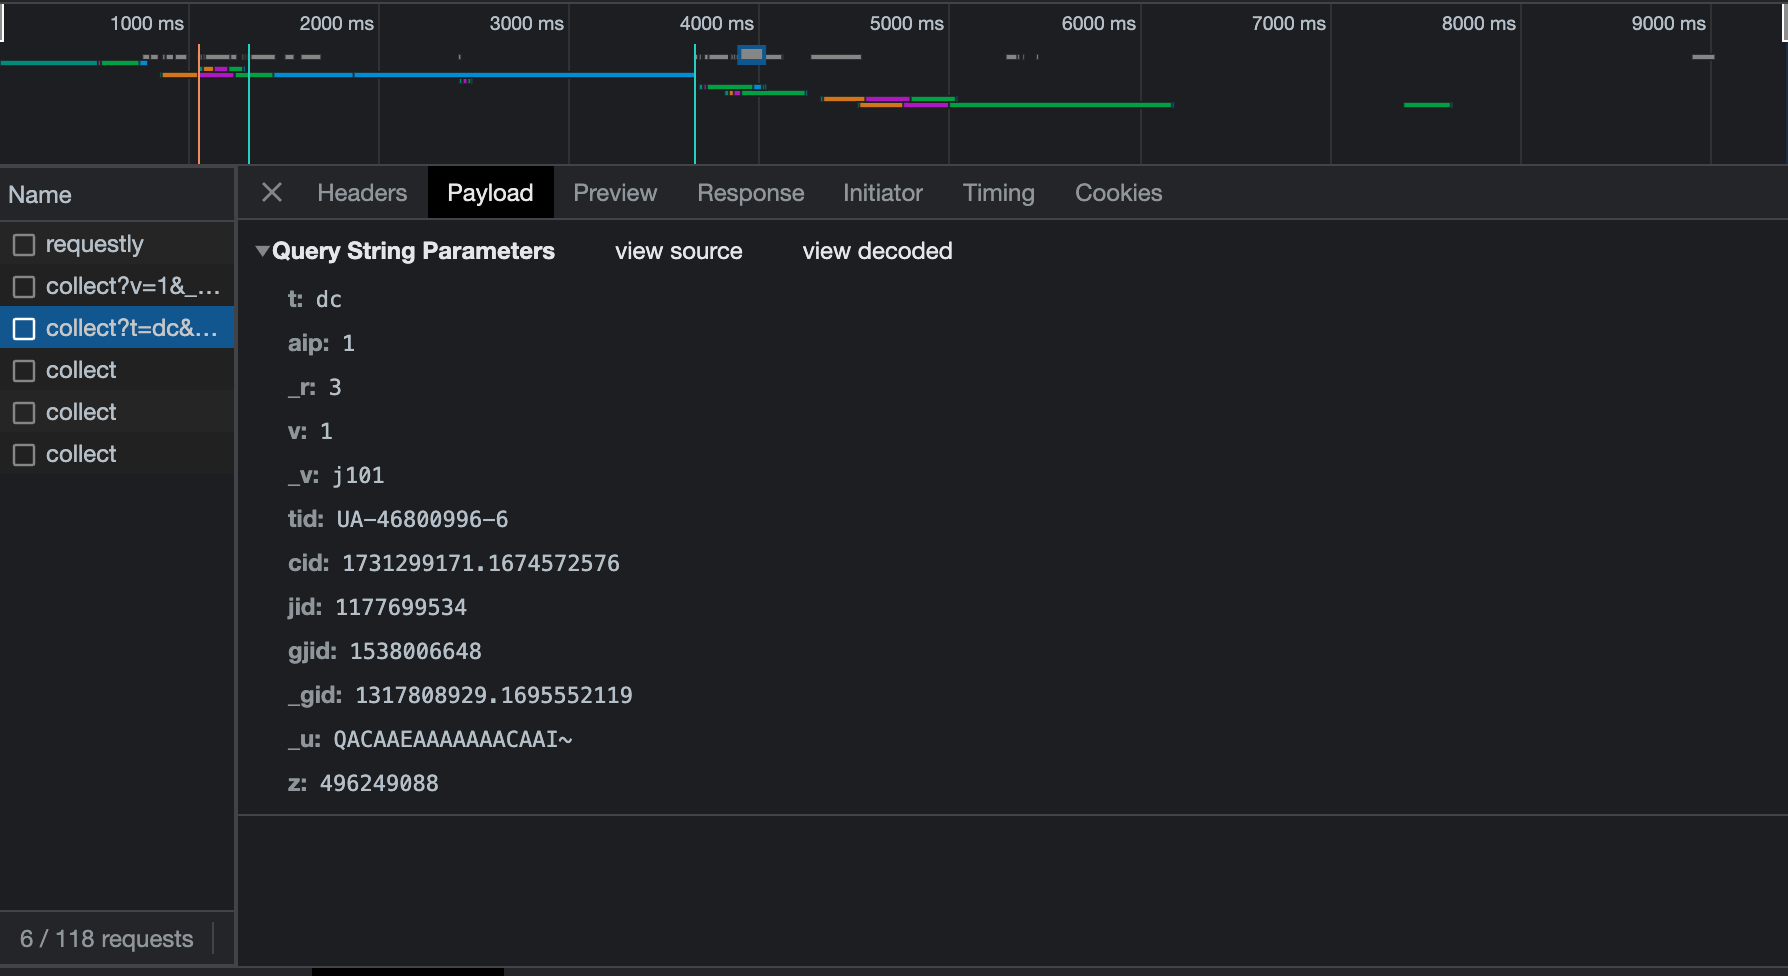
Payload & Status Panel
The Payload (or Params) panel displays the payload data for POST requests(i.e., the data sent by the client to the server). For GET requests, this panel shows any parameters passed in the URL. The Status panel shows the status of the request by representing it with a unique code.
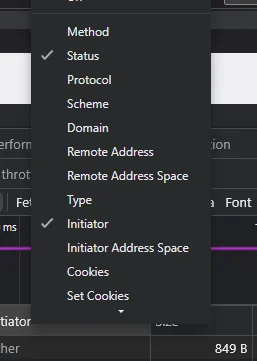
There are a bunch of other useful columns that can be configured to display in the Network tab by default. All you have to do is right-click on any column headers and select/deselect whatever you want to appear as the column.
File Types
Just over this information, you'll see the different file types present as default filters for sorting the scripts. You can click on any of those to filter out the specific files for monitoring them. You can also manually search for different requests by typing in the filter search field.

Other Elements
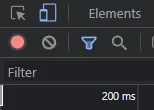
Apart from the network panels and file types, the Chrome dev tools have a few other elements. You'll see a bright red button in the dev tools window at the top left. It means that the network is currently being recorded, and any incoming or outgoing requests on that particular page will be recorded and show up on the network log. If you want to stop logging the network activity, click the button, and it will stop recording all network activities. You can also reset the entire network panel by clicking the Clear button next to it.
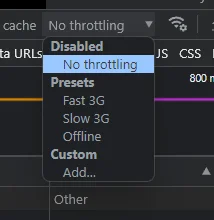
You can also emulate alternative network conditions on your webpage by changing the network connection. You can test it on different connection options like "Fast 3G", "Slow 3G", etc. It will allow you to analyze the page better as it would load on a mobile connection rather than the standard P.C. connection, which generally tends to perform a lot better.
There, I hope you now have a better understanding of the Network tab in DevTools. Start fiddling around with it and set up the perfect web development environment for you.


.png)
.png)


